


Technical Report 146, c4e-Preprint Series, Cambridge
Screening and techno-economic assessment of biomass-based power generation with CCS technologies to meet 2050 CO2 targets
Reference: Technical Report 146, c4e-Preprint Series, Cambridge, 2014
Associated Themes:
![]()
- Techno-economics of 8 Biopower CCS technologies ranging from TRL 4 to TRL 6-7.
- Net efficiency penalty due to CO2 capture varied between 0 and 15 percentage points.
- Specific investment costs increased in the range 45-130% with CO2 capture.
- Co-firing percentage, i.e. weighted feedstock cost, a key driver of LCOE.
- Lack of financial incentives for electricity generation with negative CO2 emissions.
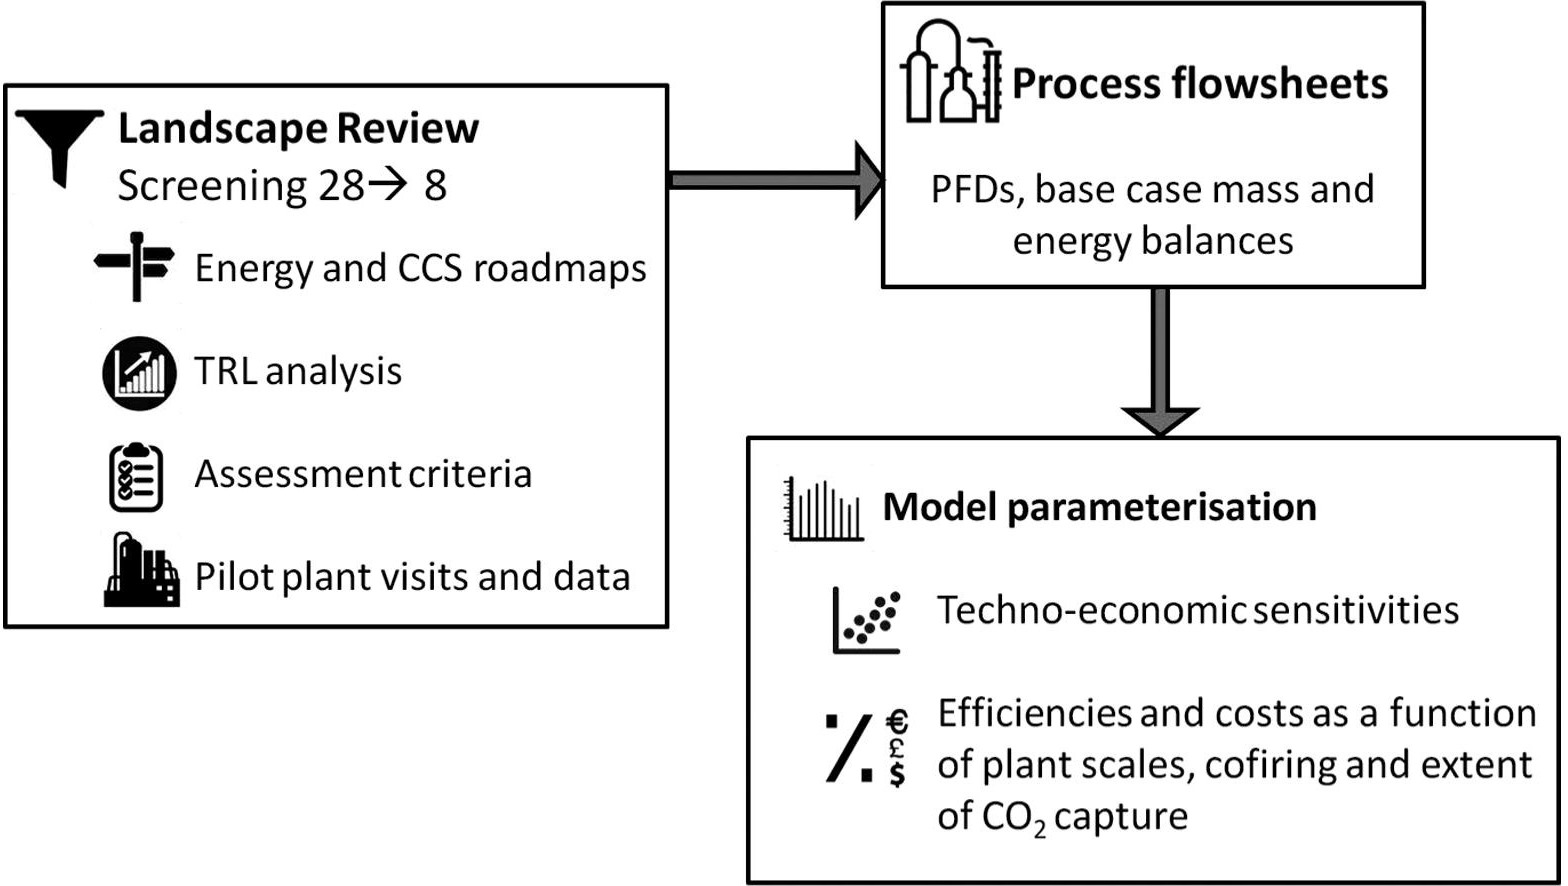 The paper presents the results of a desk-based review and analysis based on pro- cess engineering, optimisation as well as primary data collection from some of the leading pilot demonstration plants in Europe, from the perspective of deployment of Biopower CCS by 2050. Twenty eight biopower CCS technology combinations involving combustion or gasification of biomass (either dedicated or co-fired with coal) together with pre-, oxy- or post-combustion CO2 capture were identified and as- sessed. Techno-economic characteristics such as capital and operating costs, LHV% electrical efficiencies as well as CO2, SO2 and NOx emissions were modelled as a function of nameplate capacities, extent of co-firing and of CO2 capture, covering the critical period up to 2050. Only those options able to reach TRL 5 (pilot scale) by 2020 were considered likely to be advanced enough to be able to contribute to mass deployment by 2050, given industry lead times. It was observed that the net effi- ciency penalty due to carbon capture varied in the range of 6 to 15 percentage points, whereas the specific investment costs (CAPEX) increased significantly in the range 45% to 130%, with annual operating and maintenance costs growing by 4% to 60%. The plant scale (MWe) was observed to be the principal driver of capex (£/MWe), rather than the choice of technology, with larger plants having lower specific capital costs. The co-firing %, i.e. the weighted feedstock cost, is one of the key drivers of Levelised Costs Of Electricity (LCOE), with dedicated biomass options using ex- pensive pellets always having significantly higher LCOE than co-firing with cheap coal. The data collected highlighted the lack of financial incentives for generation of electricity with negative CO2 emissions, and also indicated that the most signifi- cant barriers to the deployment of Biopower CCS technologies will be economic and regulatory in nature, rather than technical.
Material from this preprint has been published in Applied Energy.
PDF (683.5 KB)